Amateur Radio Astronomy
located 51 14'53.1N 1 34'15.6W
The objectives of the Hydrogen Line Observing Group ( HLOG ) are to use a back yard radio telescope to make observations of radiation from Neutral Hydrogen. Initially our observations will be limited to Galactic Hydrogen and the data collected is being used to help us understand the shape, structure and motion of our Galaxy, the Milky Way.
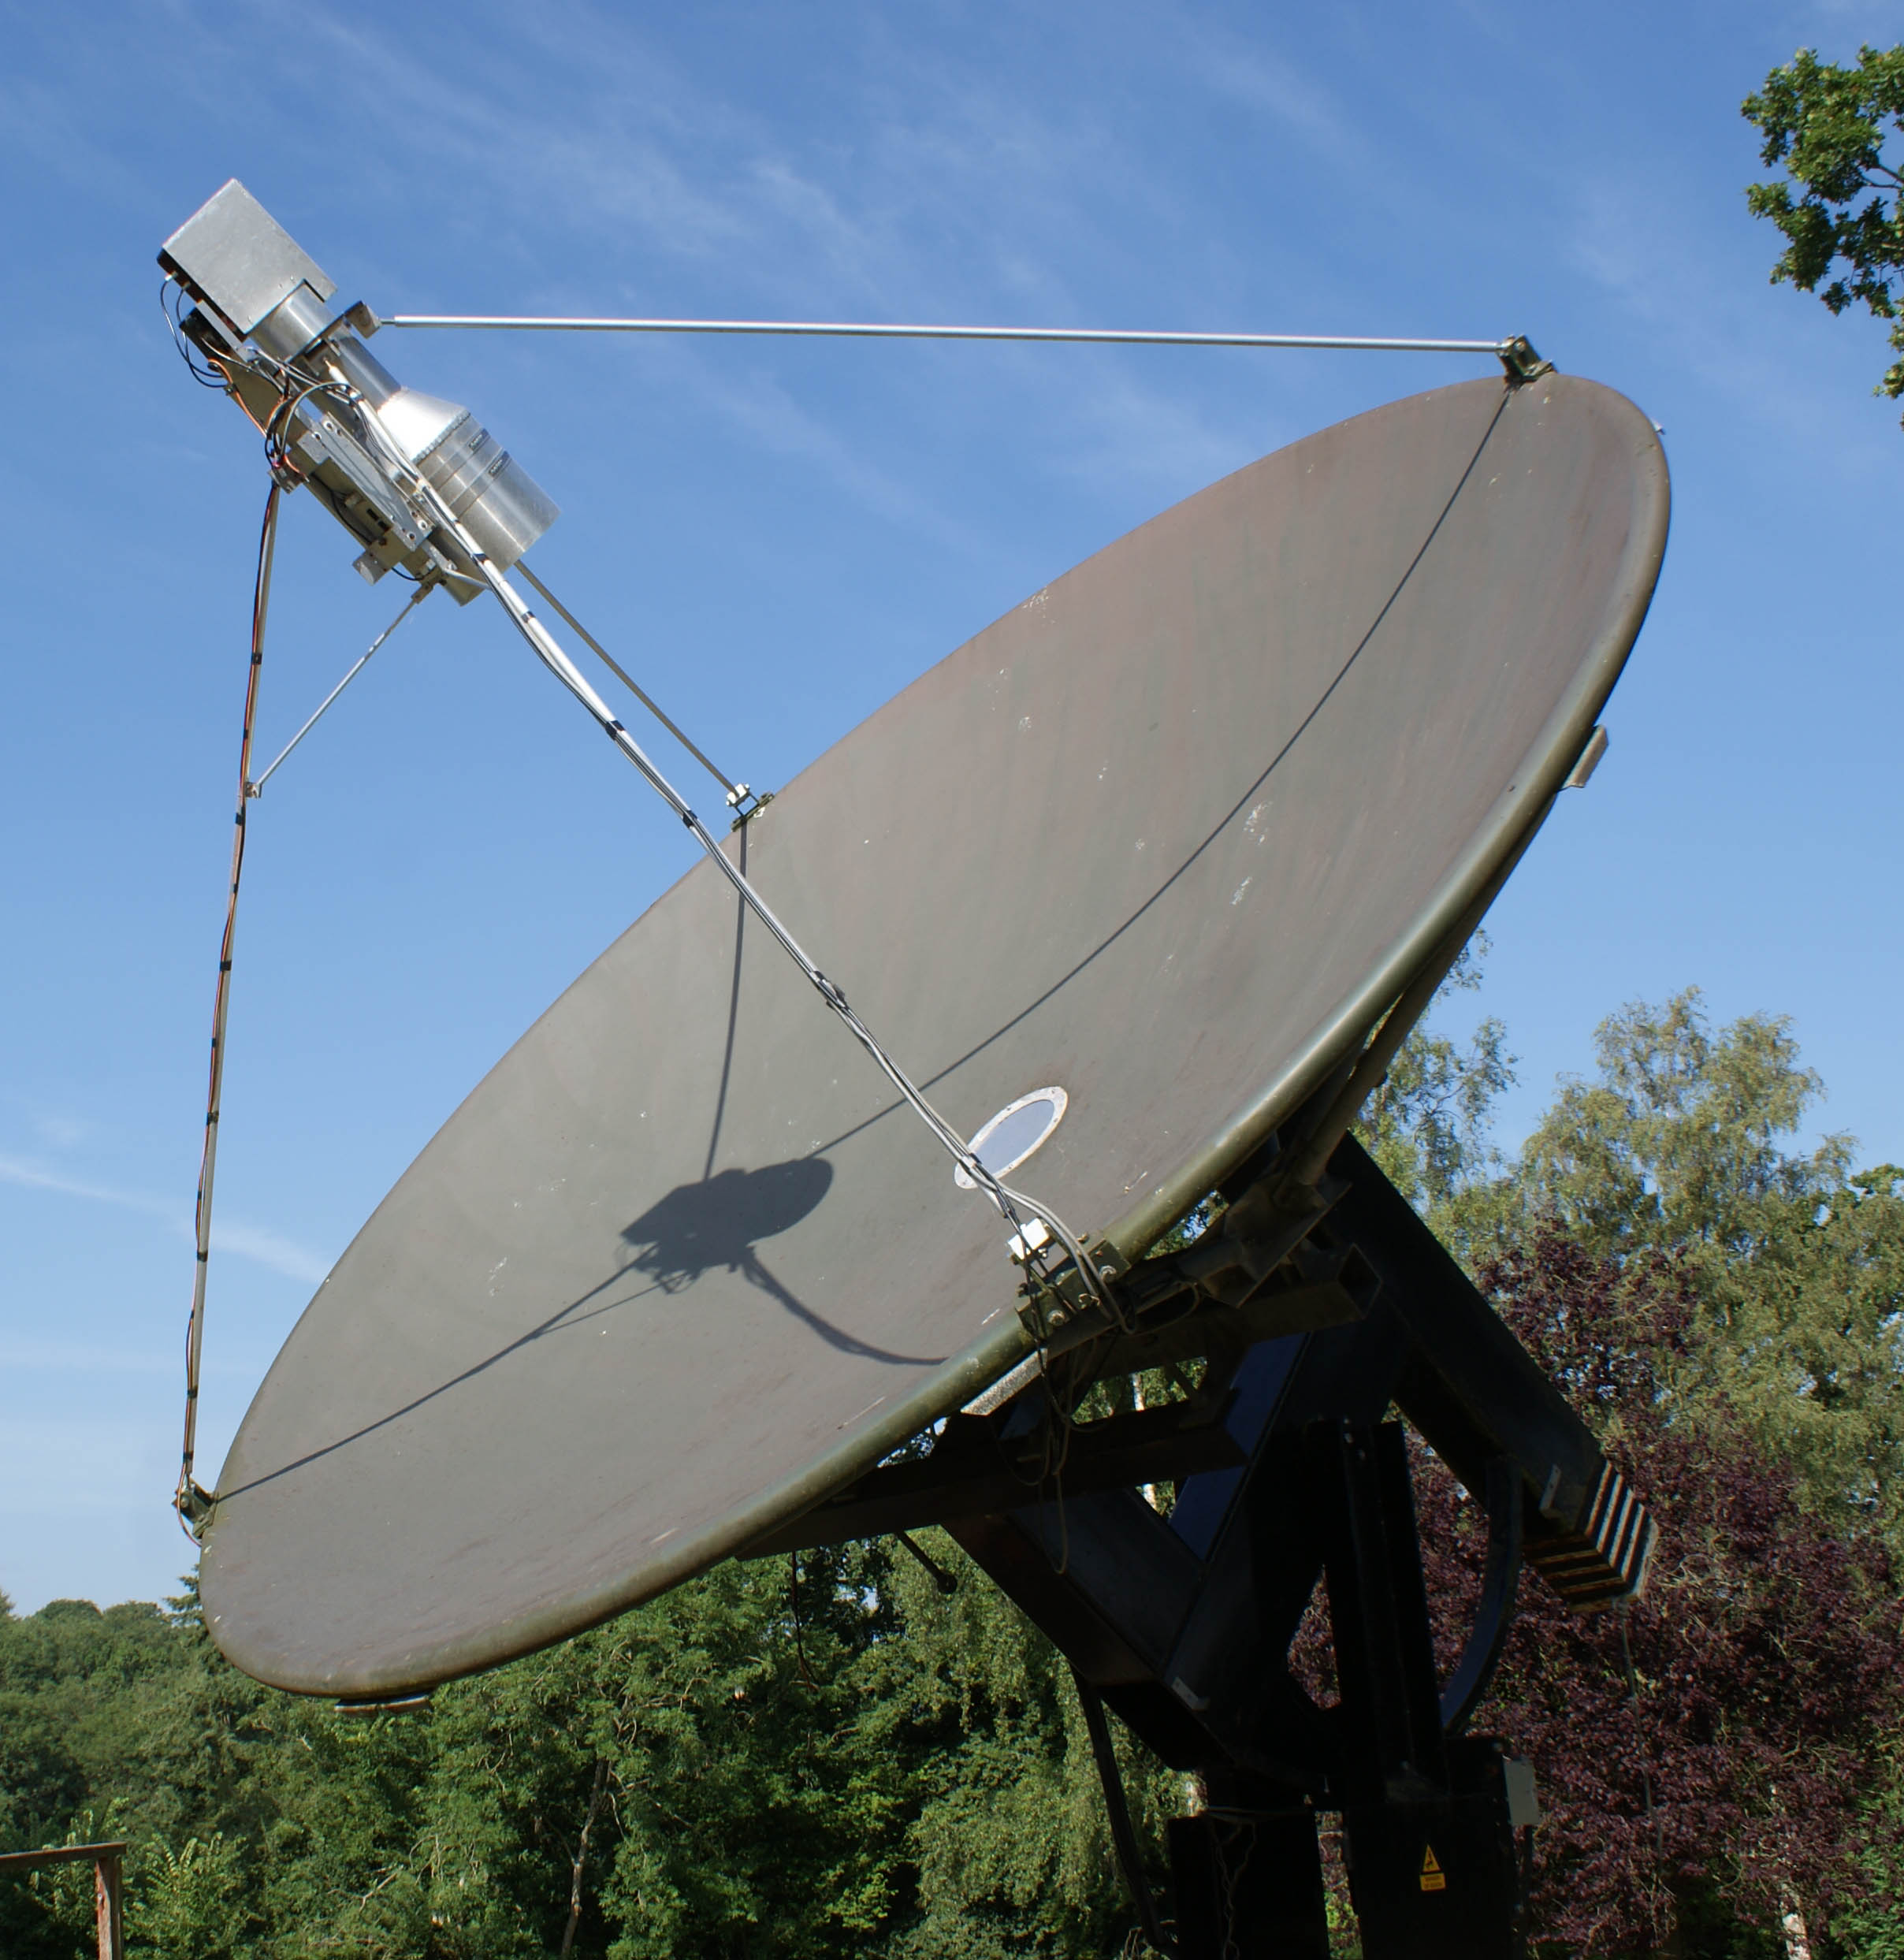
The Telescope is a 3.7m dia ex Ku Band dish with an f/d of 0.43. It is fed with a dual mode feed horn located at the prime focus.
Located at the rear of the Feed Horn are the LNA, a G4DDK VLNA tuned for 1420MHz and a down converter to a fixed IF of 144MHz. The Noise figure of the VLNA is 0.26dB and when coupled with the slight under illumination of the dish ground noise and side lobes have been minimised to achieve a system temperature of about 48K.
|
|
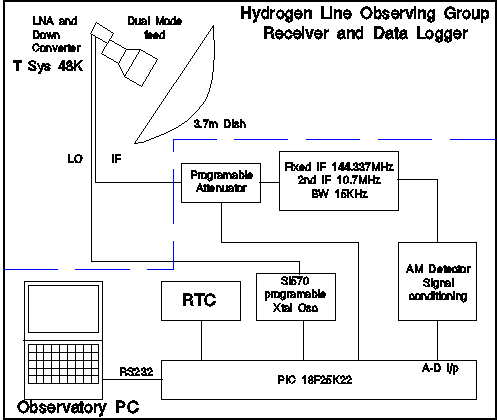
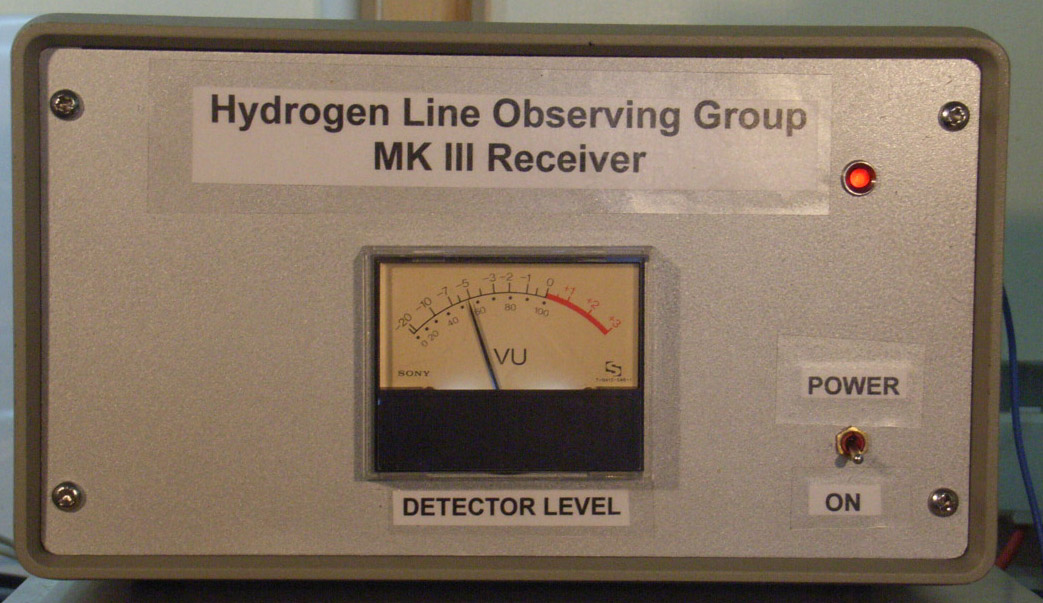
| The receiver is of conventional and simple design using an LNA and down converter to a fixed IF at the feed to minimise cable losses and reduce transmission line effects in the 25m run from the telescope to the observatory. | The Observatory PC controls all functions of the receiver via RS232 to the PIC microcontroller in the receiver, so there are no front panel controls. The PC also controls the telescope tracking micro controller via an RS422 link. |
|

|
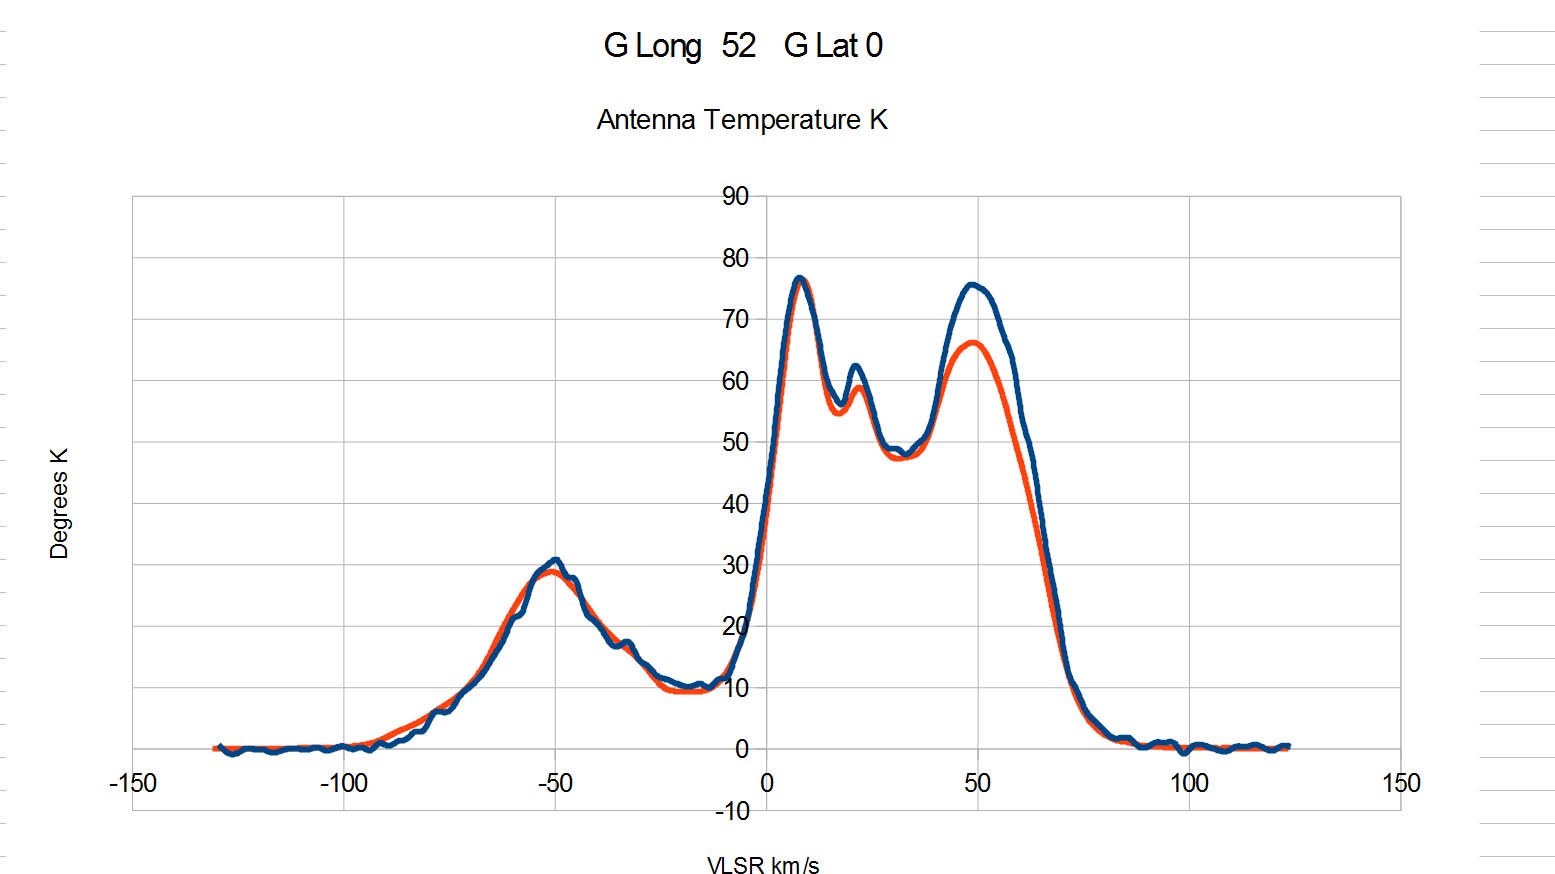
| The HLOG receiver controls the frequency, scans the spectra of interest and logs the data as a .csv file with a header containing the date, time, calibration and other data. This file is transferred to a spread sheet that calculates the Velocity Referenced to the Local Standard of Rest ( VLSR ), antenna Temperature and compensates for the filter slope to produce a plot like this. The blue line is data from the HLOG observation and the red line is the prediction from the professional LAB Survey adapted for a small telescope with a 5 degree beam width. Antenna Temperature is the measure of radio “Brightness”. | The system fixed IF can be split between the HLOG receiver and a Software Defined Radio ( SDR ) such as the Fun Cube Dongle, and using software such as Spectravue, in continuum mode, can produce a “real time” reproduction of the spectra, although the image is reversed horizontally and has no valid VLSR or antenna temperature scales. |
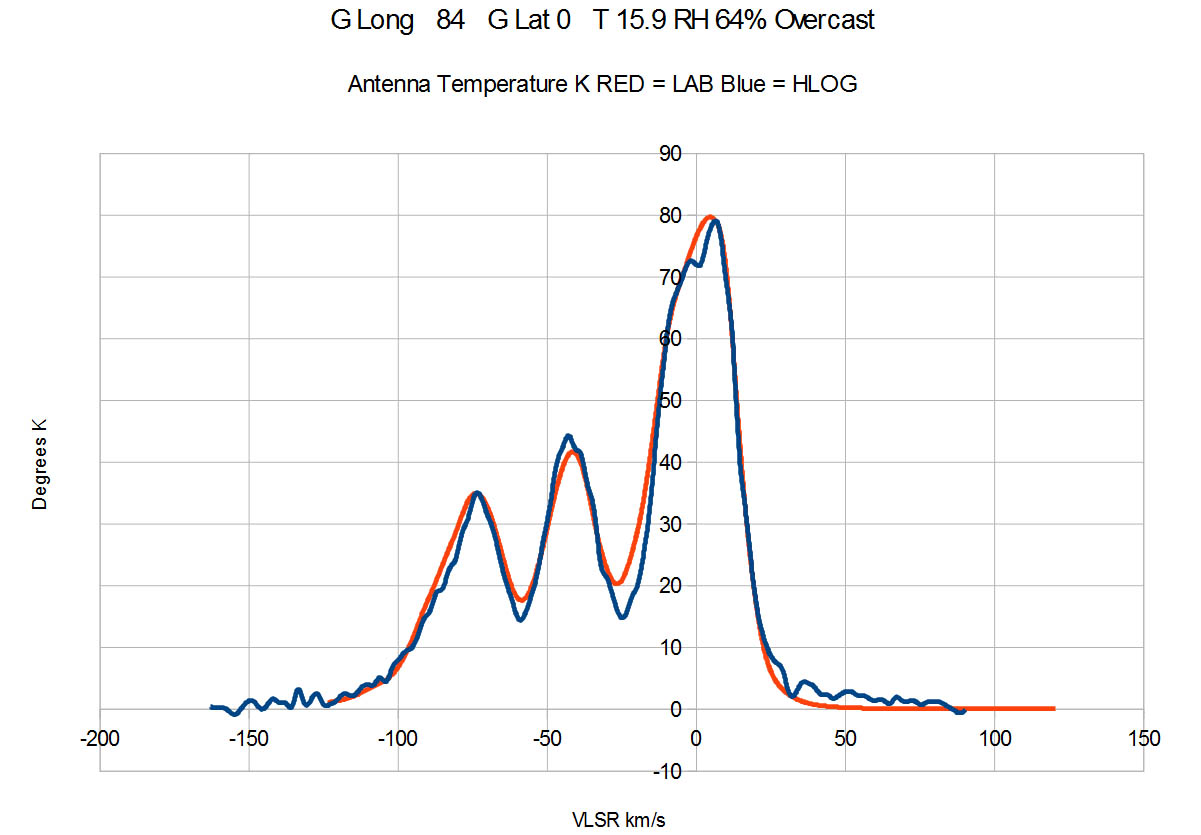
Hydrogen emits radiation at 1420.405752MHz a wavelength of 21cm in the microwave L-Band and being the most abundant element in the Universe it provides a very useful means of measuring relative velocity. When the source of radiation is moving relative to the observer it is Doppler shifted from the “rest frequency”. The above plot shows signal level, equivalent to brightness, as the vertical scale and radial velocity as the horizontal scale, derived from the Doppler equation. This observation was made "looking" in the plane of our Galaxy, the Milky Way, across its spiral arms towards Cygnus. There are three peaks due to there being three “bodies” of Hydrogen contained in the spiral arms of the Galaxy. As planet Earth has a different velocity relative to each arm, three Doppler-shifted peaks appear in this scan. The largest peak is radiation from the Hydrogen in the local Orion arm with the next peak being radiation from Hydrogen in the Perseus Arm and the right hand peak from the Cygnus arm. This plot shows the observation data from the Hydrogen Line Observing Group, using the Redenham Telescope in blue with the predicted spectra from the LAB survey (University of Bonn) in Red
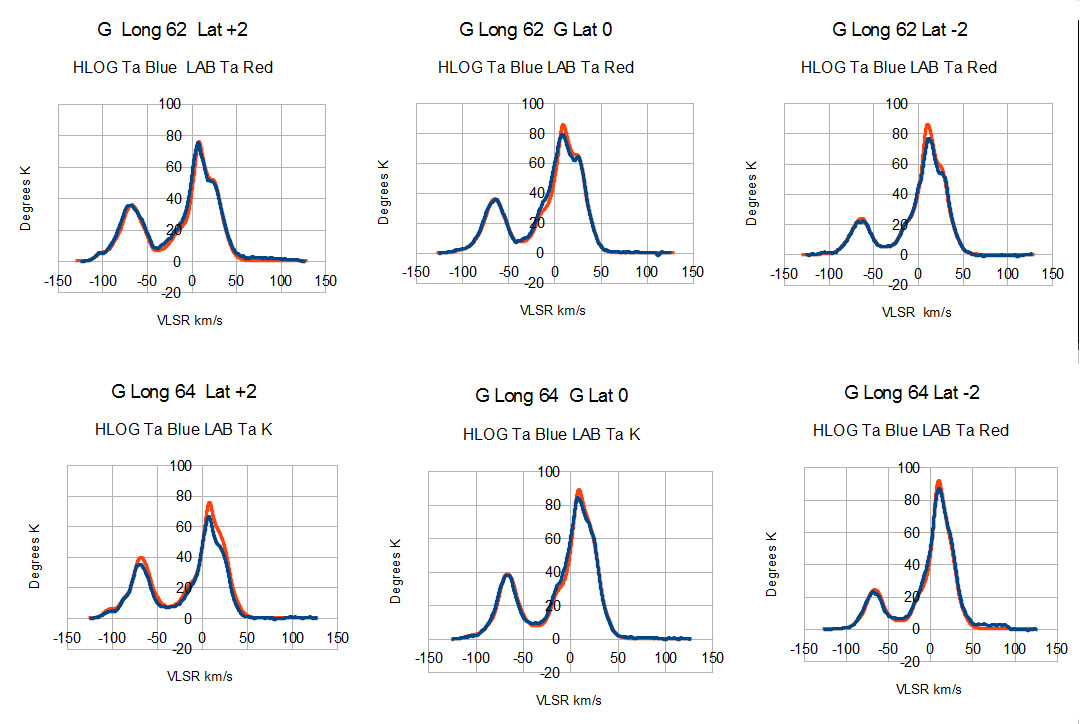
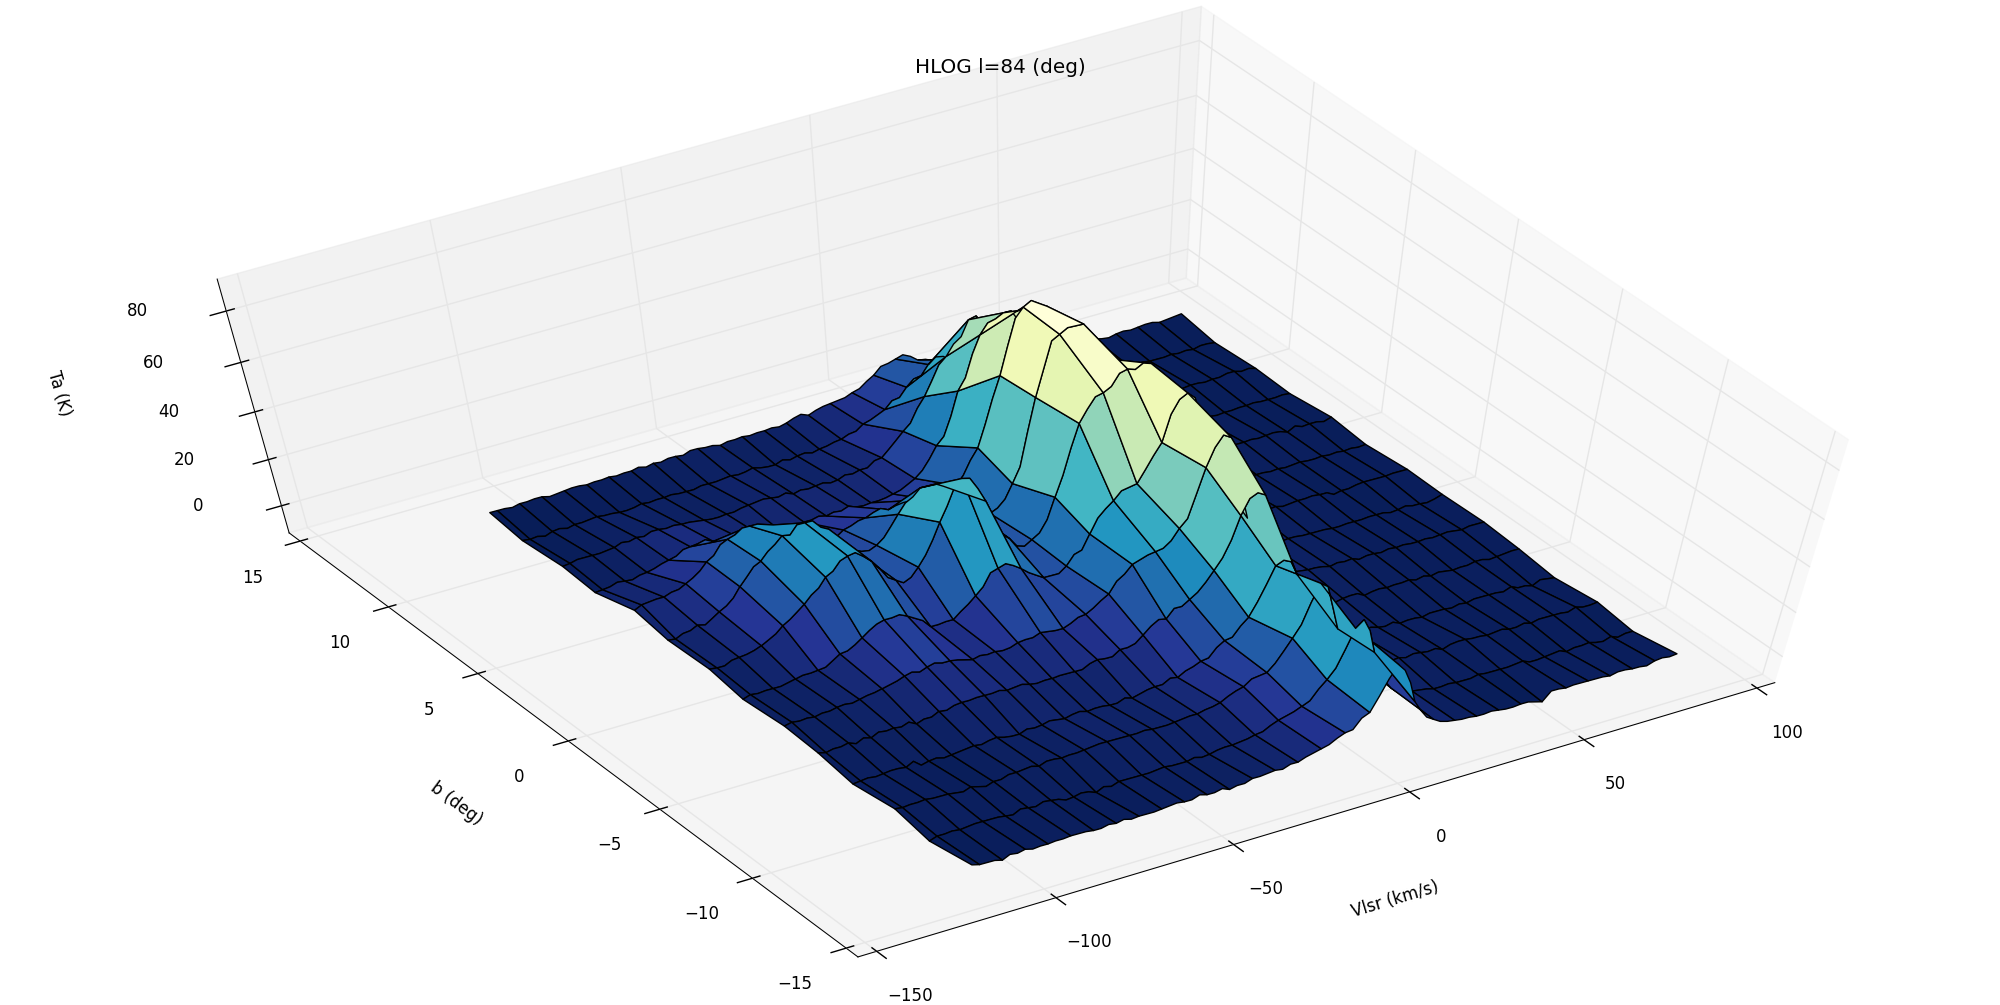
The Group have been observing 2 degree pixels along the galactic equator in longitude from l=20 to l=180 and at latitudes from b=+14 to -14.
Group members are invited to gain first hand observing experience by visiting the observatory or by joining an observing session on-line and even controlling the telescope and receiver systems themselves.
To date we have observed over 800 pixels. Our data is held on a group server, to which members can have access, and which also hosts useful tools to help visualise the data in different ways including these 3 D images which help us to understand the structure of the galaxy.
|
|
|
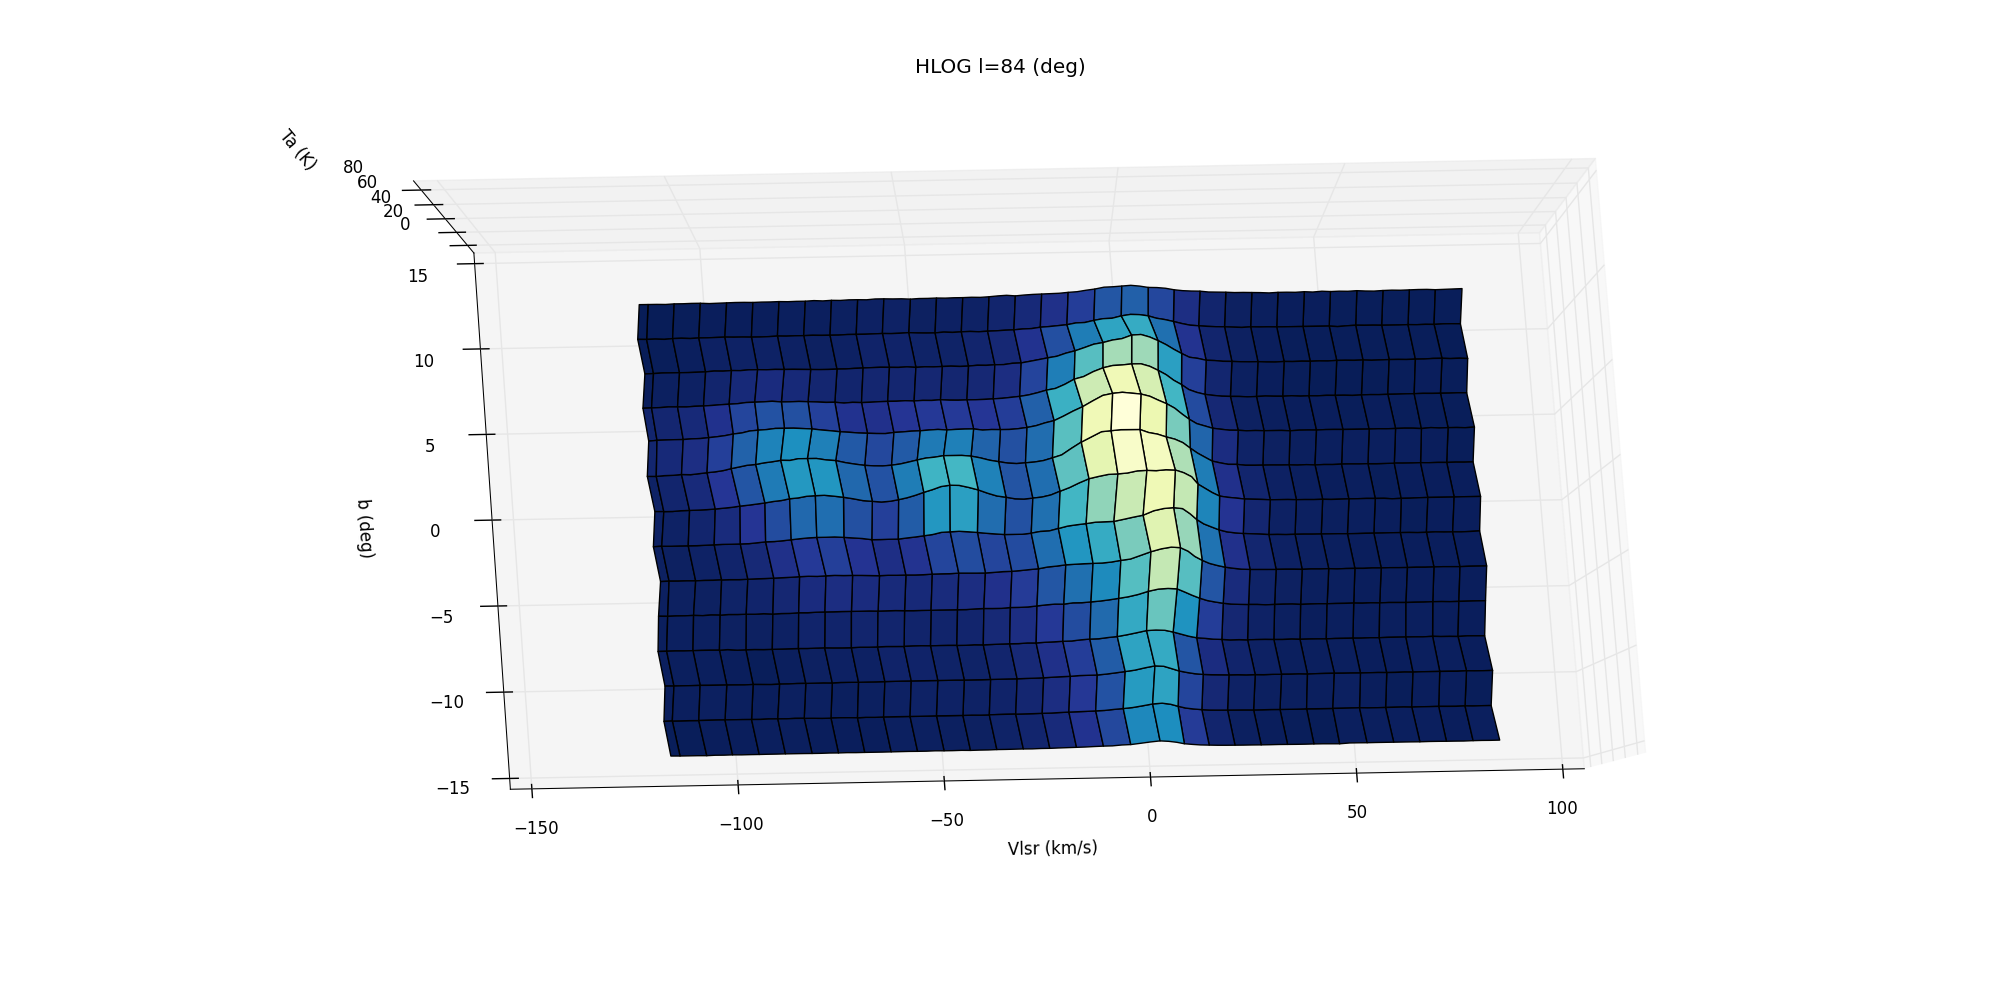
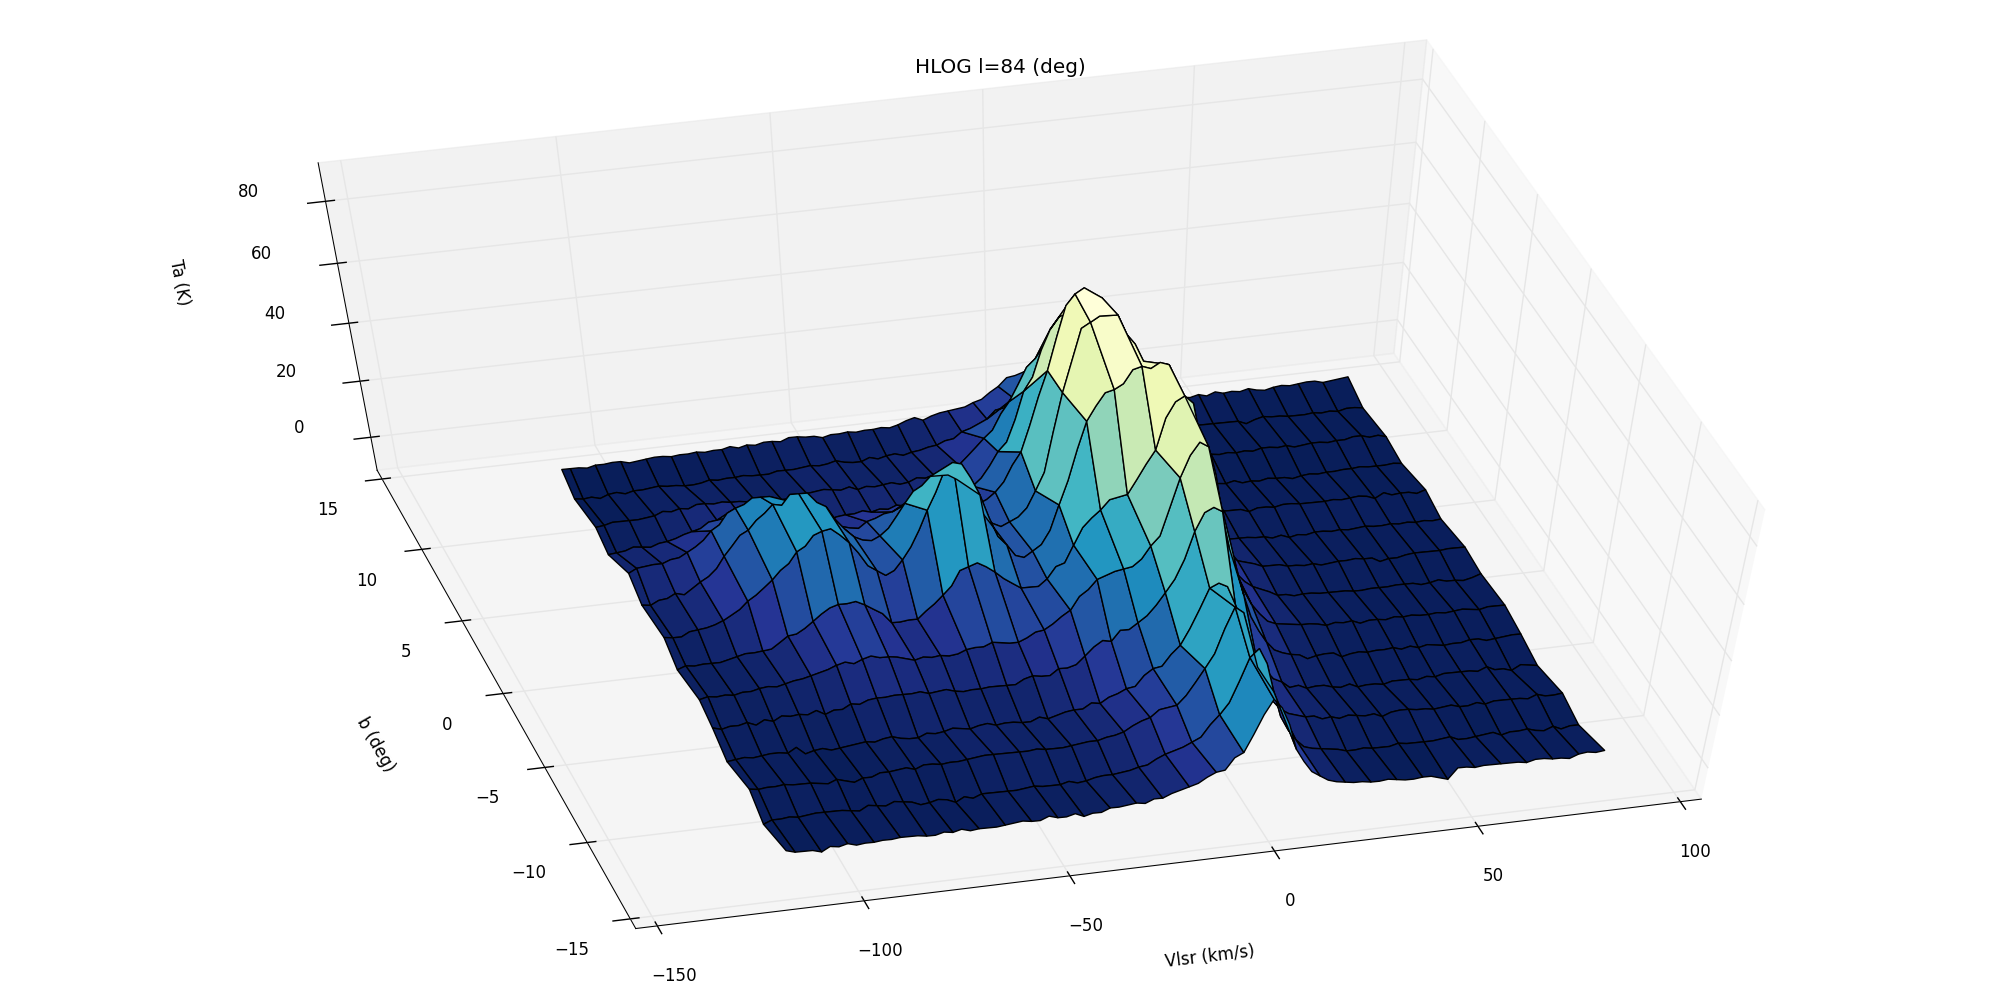
| The scales in this image are Latitude, Velocity (VLSR) and Brightness which is proportional to the mass of hydrogen in the beam. Peaks with positive VLSR are RED shifted, those with negative VLSR are BLUE shifted. | This oblique view shows local hydrogen with a VLSR of close to zero, surrounding us in latitude and two peaks associated with other bodies of Hydrogen in the galaxy which subtend a smaller angle as viewed from planet Earth. | Even the brightness of our local Hydrogen fades rapidly as we observe further above and below the Galactic plane showing how thin the galaxy is. |
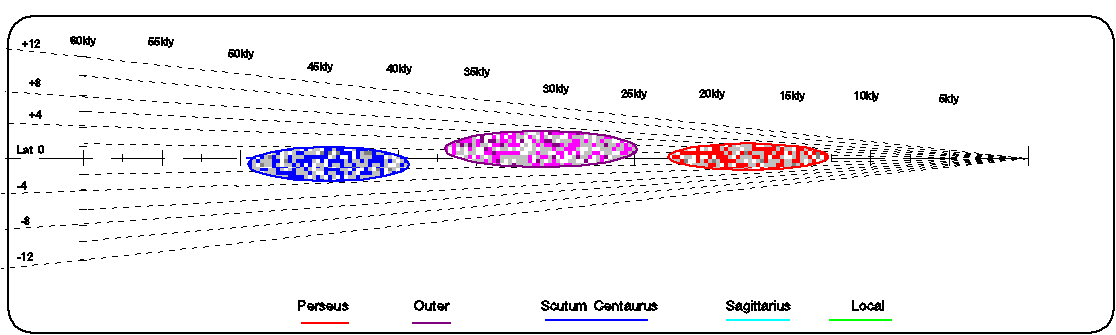
By studying the spectra we can begin to correlate the peaks with the known structure of the Galaxy using a source such as the artists illustration from the Spitzer survey and using simple trigonometry together with the brightness and velocity data from our observations, and with some artistic licence, we can construct a representation of a slice through the Galaxy.
An observations made in the plane of l=90 - l=270 for the full 360 degrees of latitude , using the brightness of Hydrogen with close to zero VLSR gives a plot like this.
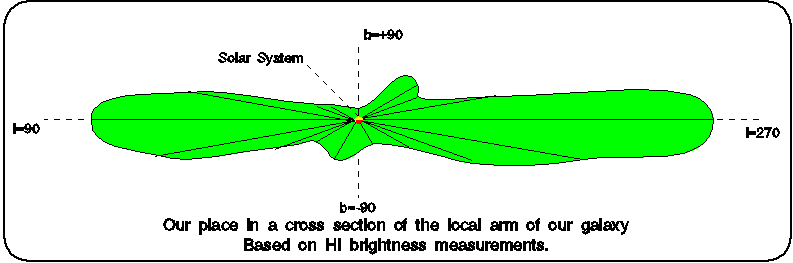
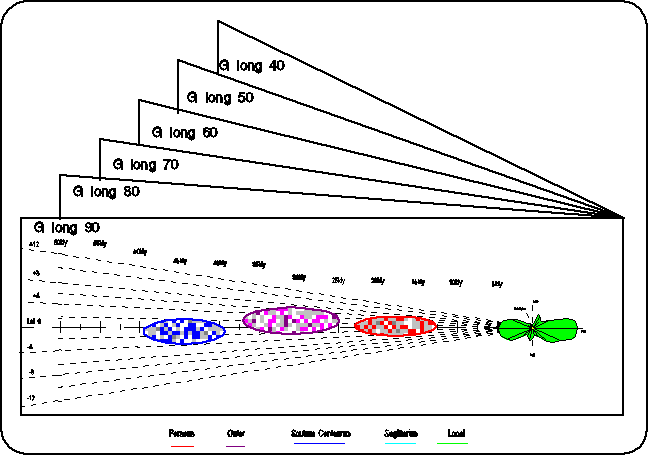
Again this indicates how flat the Galaxy is. Putting this together with the cross section of radiation brightness at other VLSRs that have been correlated with distance we could get an image like this and by repeating the process for different longitudes build up a 3D image of part of the galaxy.
If you can help us improve upon this very crude visualisation of the HLOG data you would be most welcome to join the group. You will find my email address on my Home page.
Galaxy Rotation Curve
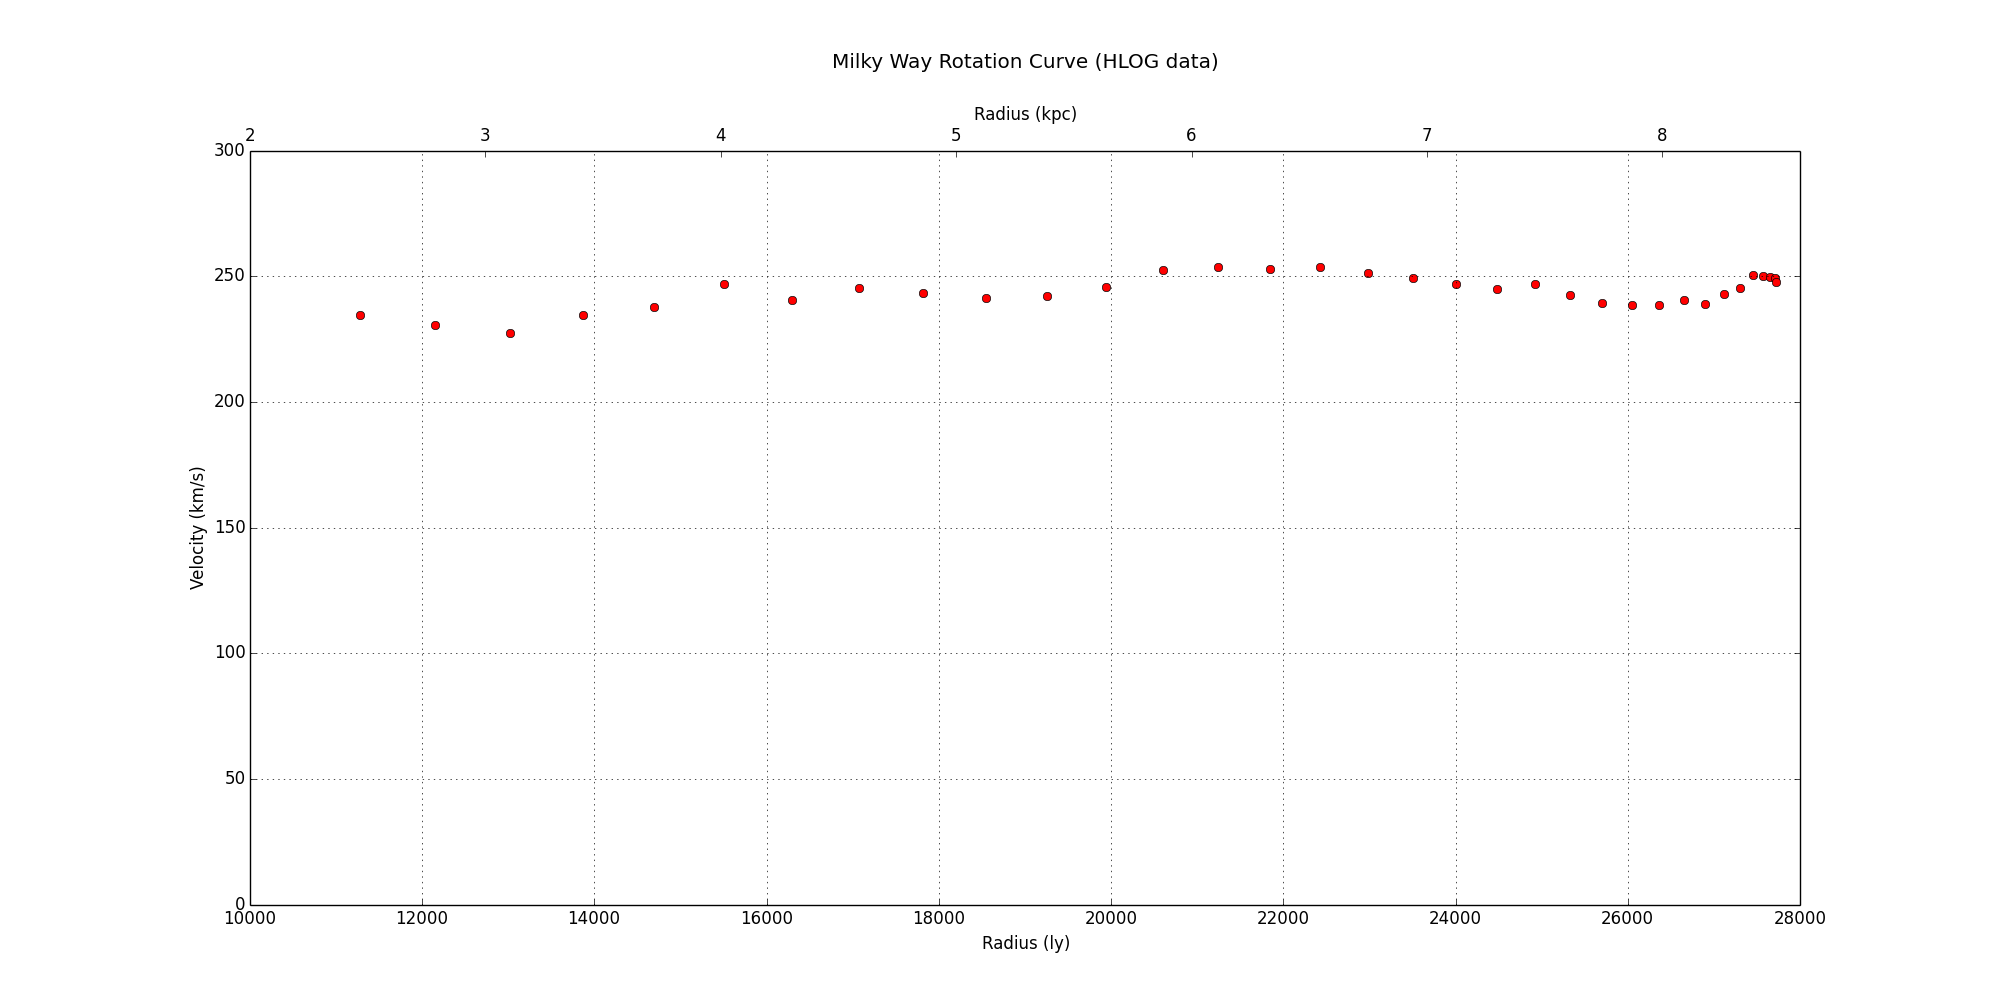
The HLOG observation data can also be used to calculate and plot the Galaxy rotation curve for the first quadrant of the galaxy. It is the unexpectedly flat nature of this curve, which does not obey the principles of Kepler for a system with most of it's mass at the centre, as appears to be the case for our galaxy, that gave rise to the "discovery" of DARK MATTER.
Some recordings of meteor echoes and radio echoes from Aurora can be found here.
Return to G4NNS Home page
Visitors since 31st Jan 2012